
2001
is shaping up as a challenging year for keeping corn production input costs
in line with potential returns. With rising fertilizer prices, nitrogen management
will play a significant role in attempting to realize potential profits. From
an economic perspective, the goal is simply stated. Apply a nitrogen rate such
that higher rates won't produce enough extra corn to pay for the extra nitrogen,
and lower rates will cost you more in lower corn yields than you would save
from lower nitrogen rates. Of course, the reality is that nitrogen dynamics
within your corn fields are quite complex and hitting the nitrogen bull's-eye
becomes very difficult.
General Recommendations and Seasonal Variability
Because of the elusive nature of nitrogen targets, some question why 'general
recommendations' would even be attempted. Nevertheless, general recommendations
such as those found in OMAFRA Publication 296 (see Table 1) or rules of thumb
such as .9 to 1.2 lb of N for every bushel of expected corn yield serve as starting
points. The fine-tuning of these recommendations then requires some additional
effort and information.
General recommendations are usually based on long-term, well-run rate studies,
but we know that year-to-year variability in weather and in the response of
corn to nitrogen is large enough that the recommendations often look wrong as
we look back on a particular season. One piece of information that is helping
to sort out the year-to-year puzzle is the residual soil nitrate level that
can be measured in the early stages of the growing season by using a soil test.
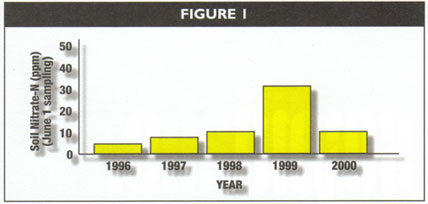
Figure 1 illustrates the soil nitrate levels measured in early June, each year,
on the same plots at the Elora Research Station, under the same management system,
over the past few years. Notice that in 1998 and 1999, soil nitrates were higher
than average, mainly due to low precipitation and above average spring temperatures.
In hindsight it appears that had we used this sort of tool to lower N rates
in 1999 by 20-50%, we would have reduced N costs without affecting yields on
many fields. The idea of soil nitrate testing across many acres seems unmanageable
to most growers; however, a simpler, but unproven, approach might be to establish
'plots' within fields that you sample carefully for nitrates (30 cm sample depth)
each year at the same time, in the same place. A record of these nitrate levels,
in time, may allow you to fine-tune your overall N rates based on the year-to-year
changes in residual soil nitrate in the soil.
| Table 1: General recommended nitrogen rates for corn. | |||||
| Region |
Expected Grain Yield (bu/ac) |
||||
|
100 |
130 |
150 |
160 |
175 |
|
|
Most Profitable Nitrogen Rate (lbs N/ac) |
|||||
| Eastern |
85 |
120 |
150 |
160 |
180 |
| Western/Central |
95 |
110 |
120 |
120 |
125 |
| Southwestern (> 2800 CHU) |
150 |
165 |
175 |
180 |
190 |
|
Note: For side-dress
applications in Southwestern Ontario, reduce nitrogen recommendations
by 15%. |
|||||
|
Source: OMAFRA Publication 296 |
|||||
Credits to Previous Crops
This is certainly not the year to ignore nitrogen credits due to previous crops
or manure applications. OMAFRA recommendations call for a significant reduction
in nitrogen rates based on previous crops (Table 2.). Remember that these credits
refer to N rate reductions from what you would apply for growing corn after
corn. So if a producer is growing 150 bu/ac corn after red clover west of Toronto
and is in a 2900 heat unit area, the N recommendation would be: 175 - 40 = 135
lbs N/acre. An interesting study out of Cornell University looked at lower input
systems within various crop rotations. Where red clover stands are good this
40lb credit is conservative and many research plots have shown that 50-80lbs
of N optimizes corn yields after clover. Table 3 points out that, in this New
York study, corn after wheat/red clover with an N rate of 85 lbs/acre yielded
quite similar to other rotations where nitrogen was applied at a rate of 145
lbs/acre.
| Table 2: Reduction in general nitrogen recommendations for corn based on previous crop. | |
| Previous Crop |
Nitrogen Rate Reduction (lb/ac) |
| Established forage - under 1/3 legume |
0 |
| Established forage - 1/3 to 2/3 legume |
50 |
| Established forage - over - legume |
100 |
| Perennial legumes plowed in seeding year |
40 |
| Soybeans or field beans (< 2800 CHU) |
30 |
| Soybeans or field beans (> 2800 CHU) |
15 |
| Cereal - straw removed (< 2800 CHU) |
10 |
| Silage corn |
10 |
| Grain corn and other crops |
0 |
|
Source: OMAFRA Publication 296. |
|
| Table 3: Average corn yields in different crop rotations from a 6 year study (1992-1997) Aurora Research Farm, New York. | ||
| Rotation |
Conventional
Management |
Low
Input Management |
|
corn yield (bu/ac) |
||
| Continuous corn |
124 |
95 |
| Soy-corn |
144 |
129 |
| Soy-corn-corn |
139 |
101 |
| Soy-wheat-corn |
147 |
139 |
| (wheat underseeded to clover) | Source: W. Cox and G. Bergstrom, Cornell University | |
| Table 4: Assessing the impact of applying an additional 40 lbs N/acre at various nitrogen fertilizer prices. | ||
|
Nitrogen
Cost |
Nitrogen
Cost |
Increased
corn yields required to cover additional N cost. |
|
.30 |
12.00 |
4.0 |
|
.35 |
14.00 |
4.7 |
|
.40 |
16.00 |
5.3 |
|
.45 |
18.00 |
6.0 |
|
.50 |
20.00 |
6.7 |